


Oklahoma Excel Math NIC
Introduction
For the 2022-2023 school year, we are privlidged to work with: Bethany Public Schools, McAlester Public Schools, Moore Public Schools, Norman Public Schools, and Roland Public Schools. Each district team will be led by an Improvement Fellow and build upon the work established the past three years.
Background
The Math NIC, like all NICs is grounded in a working theory of improvement. The theory of improvement outlines the aim, or goal that is trying to be reached, the levers in the system that need to be addressed, and specifically what instructional strategies or interventions (called change ideas) could be employed. In 2022-2023, our Math NIC will strive to improve student mathematical reasoning and justification skills to their answers in math.
Professional Learning
One of the hallmarks of Oklahoma Excel is the tailored professional development and instructional coaching offered to our participants. During the course of the NIC, our math teachers will engage in approximatly thirty hours of sustained, job-embedded, data-driven and classroom focused professional learning. In addition, each teacher will participate in several instructional coaching cycles with the Oklahoma Excel Math Instructional Specialist.


2020-2021 Student Results
Teachers who participate in Oklahoma Excel collect two kinds of data to analyze the impact the new instructional strategies are having on their students. The first type of data is an academic achievement measure of how well students are providing mathematical reasoning and justification. The second type of data is a student survey, which measures students' perceptions, attitudes, and experiences related to their math classrooms. Even with the challenges of this particular school year, the students made incredible gains in these two areas.
Academic Achievement Measure

The above academic achievement measure uses a four point rubric to assess students' ability to reason and justify their mathematical thinking. The highest possible score on the rubric is a four but our learning target was a 3. The above graph shows an increase in students' scores over the course of several months while learning occured through different modalities.
Student Survey Measure
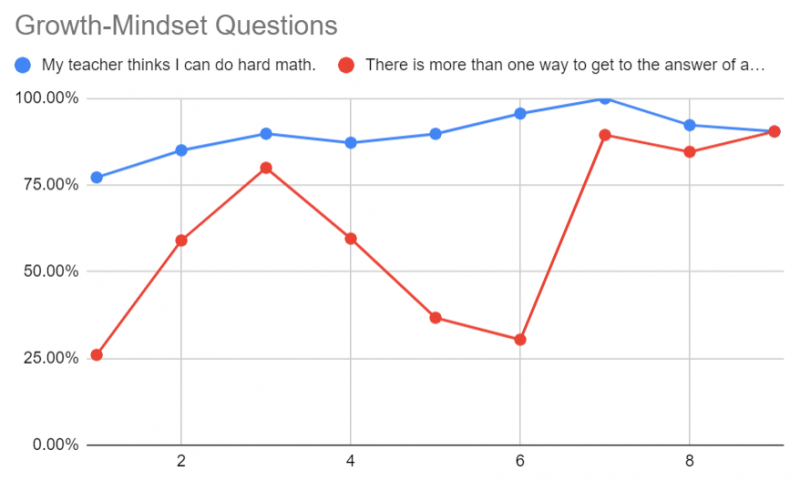

This particular student survey measure explores the mathematical mindsets of students. The blue data reflects how students' feel their teacher perceives their ability to do hard math. The red data shows students' thoughts that there is more than one way to get an answer to a math problem. This graph shows that students gained growth in their mindsets towards math, as guided by their teacher's classroom culture.

